Statistic Page Redesign
Rebuilding one of Statista’s most visited experiences around how people actually consume data

Overview
Statistic pages are some of the most visited pages on Statista. Over time, new features and content had been added without reconsidering the page as a whole. Important information competed for attention, supporting content was often missed, and recommendations were too limited to help users continue exploring a topic.
Goal
Make the statistic easier to understand, trust, and use. The page needed to answer the immediate question first, provide enough context to evaluate the data, and then help users continue exploring without becoming a collection of unrelated modules.
Company
Statista
Role
Senior Product Designer
Sector
Data & Business Intelligence
Timeline
January 2026 – Present
Scope
Product direction, research, information architecture, prototyping, visual design, coordination, and rollout measurement
Impact & Key Metrics
The redesign is still rolling out. We are tracking downloads, visualisation engagement, recommendation usage, and successful sessions, but the exact figures are temporarily obfuscated while the launch is in progress.
↗
Increased downloads
↗
Increased visualisation engagement
↗
Increased recommendations, and successful sessions
The Solution
A clearer page model that moves from understanding the statistic, into inspecting the data, and then out towards related exploration.

Start with the Statistic
The page header brings the value, context, source, and supporting information into one clear starting point.

Move into the Data
A modular visualisation structure supports clearer inspection across varied chart types and datasets.

Expand into Related Data
Broader content types and relevance scoring make the end of the page useful rather than decorative.
Process & Approach
The work combined qualitative research, a ground-up information model, cross-team coordination, and a staged rollout.
Research & Discovery
I ran 10 qualitative sessions focused on how people search for, read, evaluate, and take statistical data with them.
People looked for specific information rather than reading the page continuously. Trust became more important as the data became more consequential. Those findings shaped both hierarchy and supporting context.
Rebuild the Hierarchy
I removed the accumulated page structure and rebuilt it around one progression.
Understand the statistic → inspect the data → explore the topic further. Every section had to earn its place, and each product area had to support the same page-level direction.
Stage & Learn
The team reduced rollout risk by releasing in controlled stages.
We moved from 1,000 pages to 100,000 and then to more than 1 million, reviewing downloads, visualisation engagement, recommendation use, and successful sessions between releases.
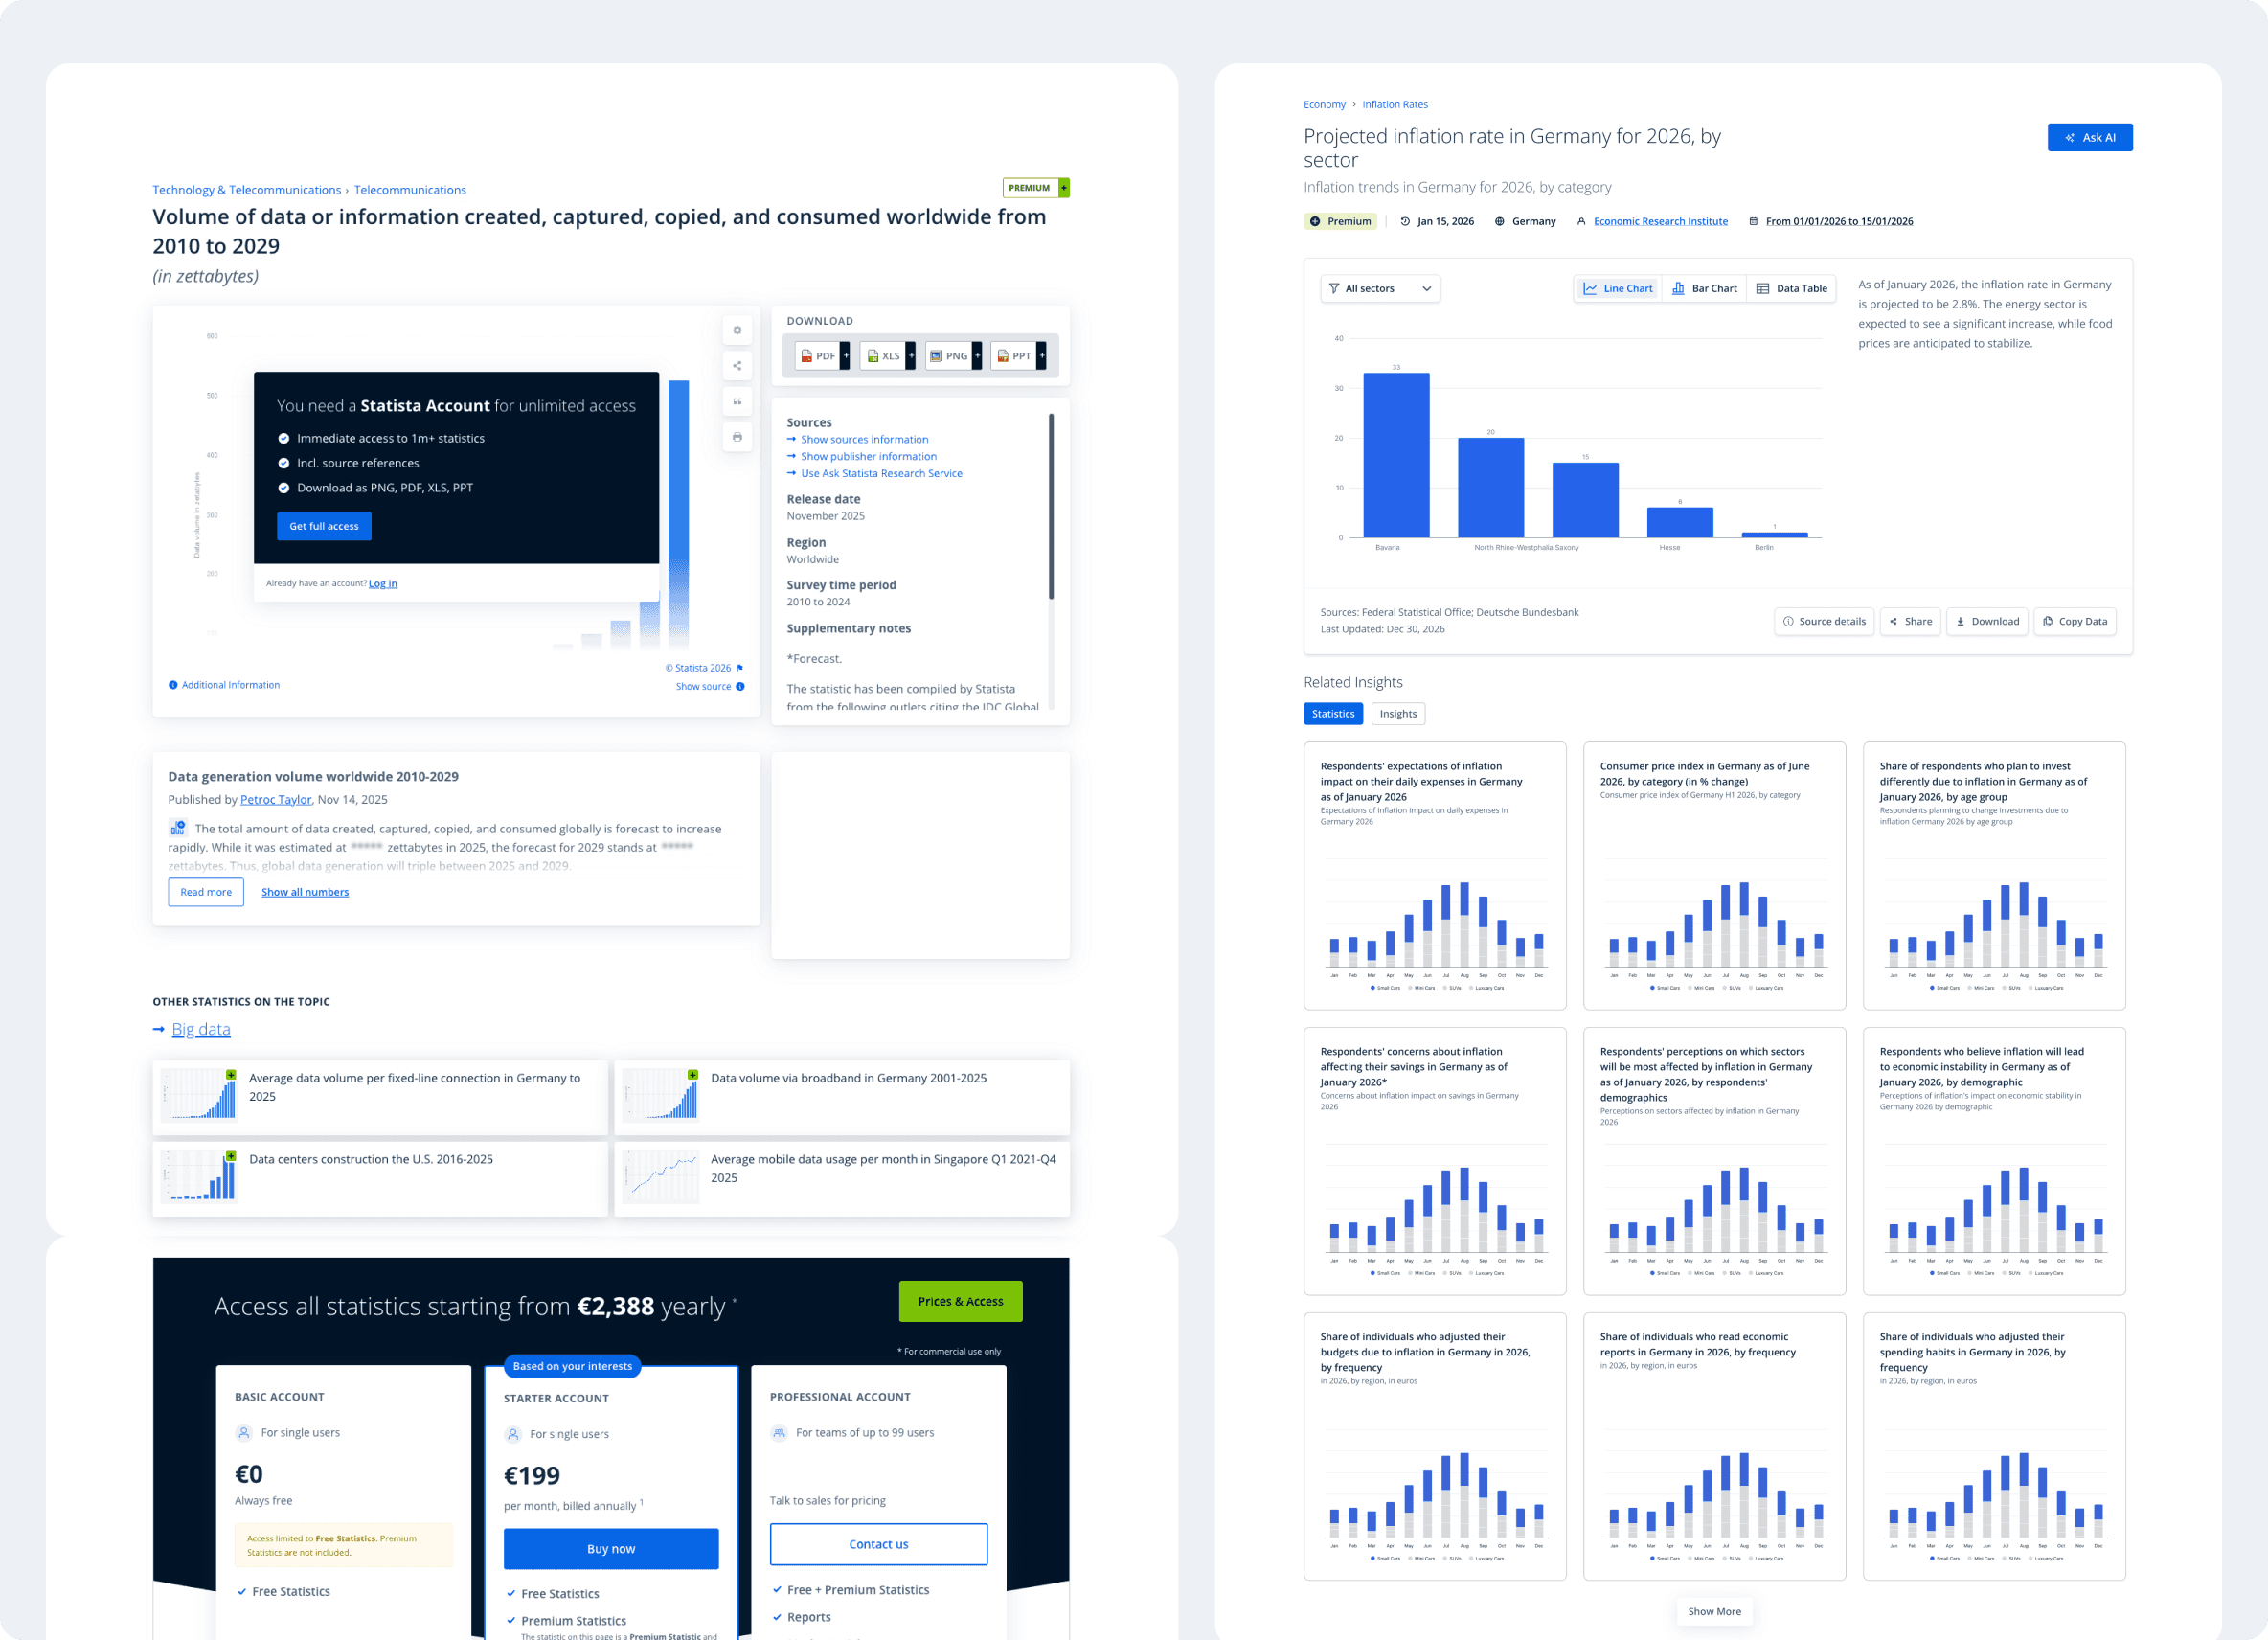
Before / after applying the new page model
Constraints & Decisions
The page had to work across a very large catalogue while remaining useful for customers, researchers, and search discovery.
Supporting Trust Without Overload
The structure had to remain useful when context was rich without falling apart when it was sparse.
Keeping Researcher Workflows Intact
The customer experience needed to improve without creating a model that internal teams could not maintain across more than a million pages.
SEO as a Product Constraint
Statistic pages are a major entry point into Statista, so clearer hierarchy still had to support how people discover the platform through search.
What We Chose Not to Ship
Not every concept that tested well belonged in the first release.
AI Summary
The interface tested positively, but Statista’s scale and content diversity made reliable implementation its own product problem.
Topic-Based Exploration
The forest-to-tree direction worked well, but depended on complete topic relationships across the underlying data.
Why We Separated Them
We kept the first release focused rather than make the page redesign dependent on systems that were not yet reliable across the platform.
Outcome
The redesign moved the statistic page away from years of accumulated features and towards a clearer product model. Users encounter the statistic first, can move into detail when needed, and can continue into related data without every part of the page competing for attention.
The staged rollout gave the team a way to test the direction against real behaviour before committing it across the platform. The redesign rolls out across more than 1 million statistic pages on September 30, 2026.